

 By
By Between 10 September and 7 October 2026, four major central banks raised the interest rate: the European Central Bank, the Federal Reserve, the Bank of Japan and, on 7 October, the Reserve Bank of India. The Bank of England held, but three of its nine policymakers voted to hike.
Between 10 September and 7 October 2026, four major central banks raised the interest rate: the European Central Bank, the Federal Reserve, the Bank of Japan and, on 7 October, the Reserve Bank of India. The Bank of England held, but three of its nine policymakers voted to hike.
Here is the awkward part. The inflation they are fighting did not arrive on a wave of reckless spending. It arrived on oil tankers, or rather failed to. Since the Strait of Hormuz was disrupted after US-Israeli strikes on Iran began on 28 February, energy has driven the price story, and Brent crude hit $106 a barrel in mid-September. An interest rate can cool a housing market. It cannot reopen a shipping lane.
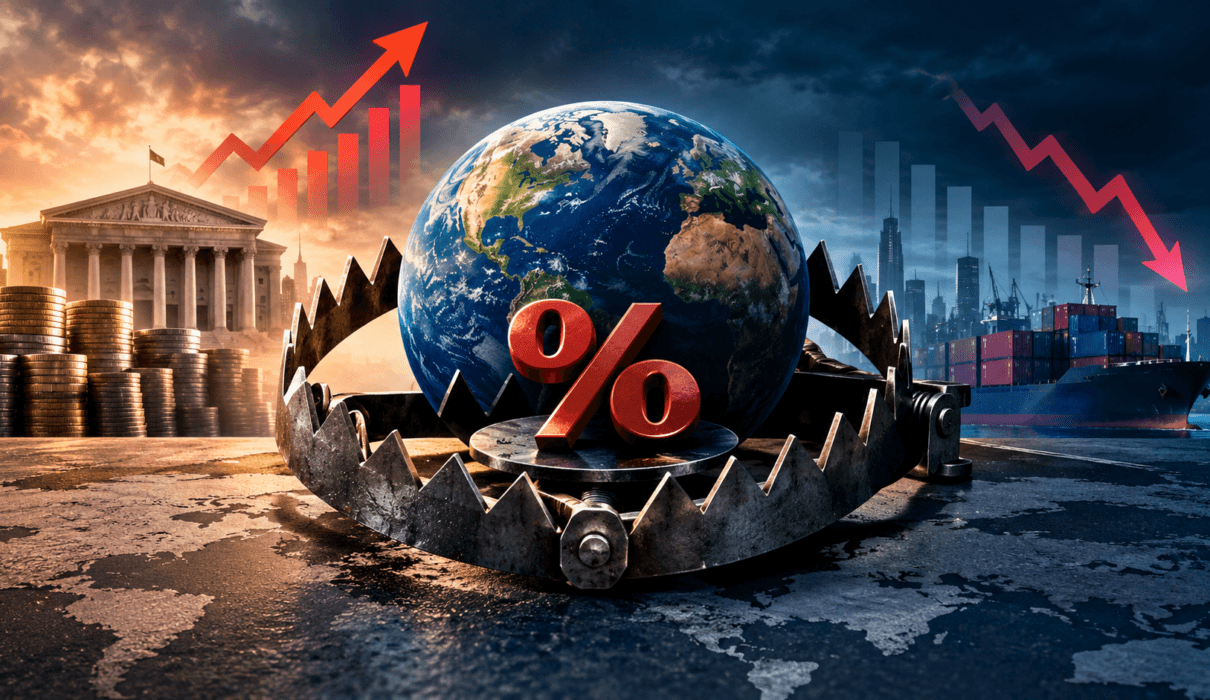
That mismatch is the global interest rate trap, and it is the biggest macro story of the autumn.
What Is the Global Interest Rate Trap?
The global interest rate trap is the bind central banks face when inflation is driven by supply shocks, such as an oil spike, instead of excess demand. Raising the interest rate protects credibility but weakens growth, jobs and public finances without fixing the supply problem. Holding rates risks letting inflation expectations drift. Either choice costs something.
Key Takeaways
- Rates are rising together. The Fed (3.75–4.00%), ECB (deposit rate 2.50%), Bank of Japan (1.25%) and RBI (repo 5.50%) all tightened within four weeks.
- Growth is already soft. The IMF’s July outlook cut 2026 world growth to 3.0% and raised its global inflation forecast to 4.7%.
- Debt makes every hike costlier. Global public debt is projected at 95.3% of GDP in 2026 and 100% by 2029.
- History is not reassuring. The ECB’s hikes into oil shocks in 2008 and 2011 were reversed within months.
- The next five weeks decide the path. The Fed, ECB, Bank of Japan and Bank of England all meet between 27 October and 5 November.
Why Is the Interest Rate Trap Different This Time?
The 2022–23 tightening was a textbook story. Pandemic stimulus, tight labour markets and snarled supply chains pushed US inflation to 9.1% in June 2022, and the Fed lifted the interest rate from near zero to 5.25–5.50%. Demand was too hot, so cool it.
The 2026 version is messier, for three reasons.
First, the shock is geopolitical. The IMF’s July outlook describes a world “at the crossroads of war and technology”: a war-driven energy shock on one side, an AI investment boom on the other. According to the US Energy Information Administration, crude and liquids moving through Hormuz averaged 4.9 million barrels a day in the second quarter of 2026, against 21.6 million in the fourth quarter of 2025. That is lost supply, not surplus demand.
Second, the starting line is crowded with debt. Global public debt is just under 94% of GDP, and interest payments have climbed from about 2% to nearly 3% of world GDP in four years, according to the IMF.
Third, central banks disagree on their own diagnosis. The Fed says inflation “remains elevated” and wants a “timelier return” to 2%. The Bank of England held because tight financial conditions and labour-market slack were already restraining prices. Same oil shock, different conclusions. When the experts disagree, you are looking at a trap, not a puzzle.
Also Read – Does Gold Always Rise With Inflation? The Truth About Gold as an Inflation Hedge
Where Do Global Interest Rates Stand Today?
Table 1: The global interest rate dashboard
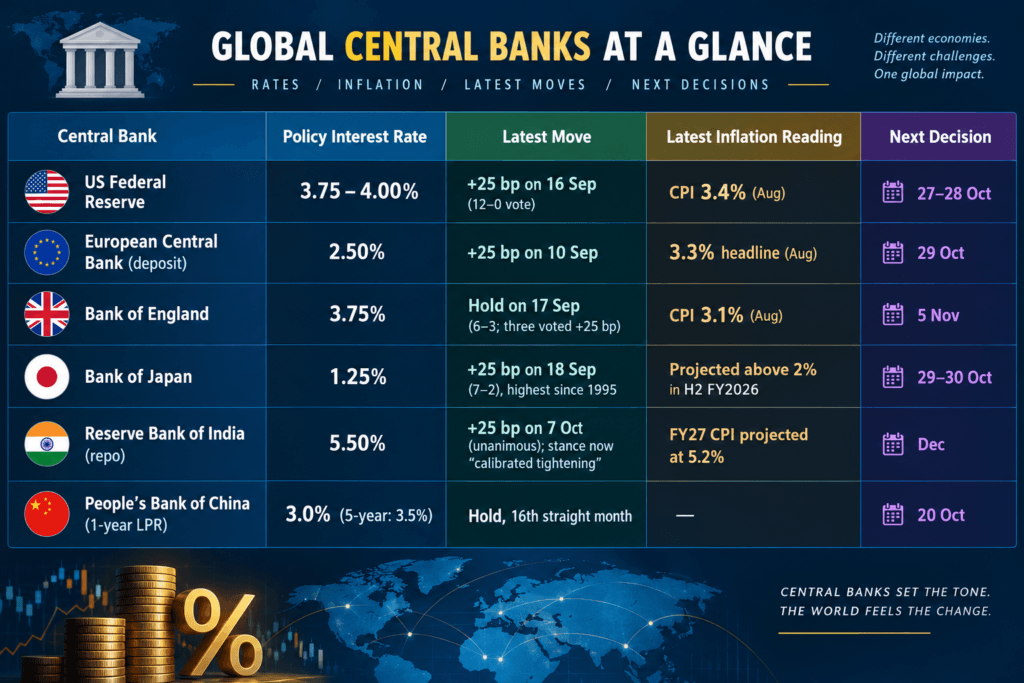
The Fed is the surprise. Chair Kevin Warsh, in the job since May, presided over the first hike since July 2023. The September dot plot points to 4.00–4.25% at the end of 2026.
Europe is hiking with almost no growth. The ECB’s own staff project euro-area growth of 0.9% in 2026 while inflation averages 3.0%. That is the trap in a single sentence.
India just joined the club. The RBI had held at 5.25% since December 2025, and Governor Sanjay Malhotra now says further cuts are “off the table” in the near term. He chose to “reinforce inflation credibility before risks become entrenched.” China, by contrast, is frozen at 3.0%, choosing growth support over defending the yuan.
Supply Shock or Demand Shock?
Every central banker learns one rule early: look through supply shocks, lean against demand shocks. A higher interest rate works by reducing spending. If prices rise because people spend too much, that works. If prices rise because oil is scarce, cutting spending lowers the oil price only indirectly, and at great cost.
Table 2: Demand-pull vs supply-push inflation
| Feature | Demand-pull (2021–22 style) | Supply-push (2026 style) |
|---|---|---|
| Root cause | Too much spending chasing too few goods | Disrupted energy, food or shipping supply |
| Typical symptoms | Strong jobs, rising wages, hot housing | Weak growth, soft jobs, squeezed real incomes |
| Does a higher interest rate fix it? | Yes, by cooling demand | Only by crushing demand until oil falls |
| Cost of tightening | Moderate, if timed well | High: output and jobs fall, supply unchanged |
| Risk of not tightening | Overheating | Inflation expectations drift upward |
The case for tightening is not silly. The Bank of England estimates that energy explains about 0.7 points of its 1.1-point inflation overshoot, which leaves 0.4 points that is not energy. The RBI says cyclical inflation risks are “no longer benign.” If energy shocks keep repeating, households expect higher prices, ask for higher wages, and a temporary shock becomes permanent.
The case against is equally strong. Warsh himself conceded in September that the Fed cannot affect the lack of safe passage through Hormuz. A hike that does nothing for the cause of inflation but slows hiring, investment and housing is an expensive gesture.
That is the trap: both options are defensible, and both can be wrong.
How Does a Higher Interest Rate Slow the Economy?
A policy interest rate reaches your life through at least five channels.
Table 3: Transmission channels of a higher interest rate
| Channel | How it works | Typical lag | Who feels it first |
|---|---|---|---|
| Borrowing cost | Loan, mortgage and card payments rise | 0–6 months | Variable-rate borrowers, small firms |
| Asset prices | Bond prices fall, valuations compress, housing cools | Immediate to 12 months | Investors, pension funds, home buyers |
| Exchange rate | Higher rates attract capital and lift the currency | Immediate | Importers in weaker-currency countries |
| Credit supply | Banks tighten lending standards | 6–18 months | Startups, commercial property, leveraged firms |
| Expectations | Credible tightening anchors inflation expectations | Months to years | Wage and price setters |
Economists often cite lags of 12 to 24 months before a policy move has its full effect on output. This is the cruellest feature of the trap: central banks steer with a delayed windscreen. The September hikes will not show their full weight until late 2027, by which time the oil shock may have faded on its own.
An oil shock is already a tax on consumers. Add a higher interest rate and households face a double hit: dearer essentials and dearer credit. That is why stagflation is on every strategist’s lips. The IMF’s 3.0% growth and 4.7% inflation is not the 1970s, but it lives in the same neighbourhood.
The Debt Wall: Interest Rates and Sovereign Balance Sheets
In the 1980s, a high interest rate hurt households and firms. In 2026 it also hurts governments, on a scale the textbooks never planned for.
Table 4: Global public debt and the interest burden
| Indicator | Figure | Source |
|---|---|---|
| Global public debt, 2025 | 93.9% of GDP | IMF Fiscal Monitor, Apr 2026 |
| Global public debt, 2026 (projected) | 95.3% of GDP | IMF |
| Global public debt, 2027 / 2028 | 97.2% / 98.8% of GDP | IMF |
| Global public debt, 2029 | 100% of GDP, last seen after WWII | IMF |
| Interest payments, global | About 2% to nearly 3% of world GDP in four years | IMF |
| US deficit; gross debt by 2031 | 7–8% of GDP; 142.1% of GDP | IMF |
| China gross debt by 2031 | 126.8% of GDP | IMF |
| Illustrative: +1 point on US debt of about $39 trillion | Up to about $390 billion a year, once fully repriced | Author’s arithmetic (upper bound) |
The last row is simple multiplication, not a forecast. Much government debt is fixed-rate and reprices only as bonds mature.
Every extra point on the interest rate feeds slowly into that bill as old bonds are refinanced, which means the damage from the September hikes is mostly still ahead.
There is a political trap on top of the economic one. The IMF says the global fiscal buffer has shrunk from more than 1% of GDP a decade ago to near zero. A government with no buffer cannot offset a central bank’s tightening with stimulus. It is more likely to cut spending or raise taxes, which tightens policy a second time. Two levers pulling the same way is how a slowdown becomes a recession.
Why Fed Hikes Hurt Emerging Markets
The Fed’s interest rate is, in effect, the world’s. When the US raises it, three things happen far from Washington:
- The dollar strengthens, as capital chases higher US yields.
- Dollar debts get heavier for emerging-market firms and governments.
- Local central banks face a nasty choice: hike to defend the currency and hurt growth, or hold and import more inflation.
The Bank of Japan shows the effect. It lifted its policy rate to 1.25%, yet USD/JPY pushed back above 157 because the gap with US rates still dominates the currency. A central bank can raise its rate and still lose the exchange-rate fight.
India is the live case. Crude above $100 widens the import bill, a weaker rupee makes that bill heavier, and an inflation-targeting central bank is forced to respond. The RBI’s hike on 7 October, from a bank that had been cutting through 2025, shows how quickly the oil shock rewrote the script. Its own projections show CPI inflation of 6.0% in the third quarter of FY27 and growth of 7.1% for the year.
Table 5: How higher US rates transmit abroad
| Mechanism | Effect on emerging markets | Policy dilemma |
|---|---|---|
| Capital outflows to US assets | Currency falls, bond yields rise | Hike to defend currency, or protect growth? |
| Dollar-denominated debt | Debt service costs rise | Spend reserves, or restructure? |
| Dollar-priced energy | Fuel inflation rises | Subsidise (fiscal cost) or pass through (political cost) |
| Weaker export demand | Trade slows; IMF sees 2026 trade growth at 3.5% | Stimulate, if buffers allow |
The pattern is not new. In the 2013 “taper tantrum,” a mere hint of tighter US policy sent Brazil, India, Indonesia, Turkey and South Africa scrambling to defend their currencies. In 2026 there is a real hike, a real oil shock and higher debt, so the risk is larger, not smaller.
What History Says About Hiking Into a Shock
Table 6: Historic hiking episodes and their aftermath
| Episode | Interest rate move | Backdrop | Aftermath |
|---|---|---|---|
| US, 1979–82 (Volcker) | Fed funds near 20% at peak | CPI peaked at 14.8% (Mar 1980) | Two recessions; unemployment hit 10.8%; CPI fell to 3.8% |
| US, 1994–95 | 3.0% to 6.0% in 12 months | Pre-emptive | Soft landing, but a global bond rout and Mexico’s peso crisis |
| ECB, July 2008 | Hike to 4.25% | Oil near its $147 peak | Lehman collapsed within weeks; ECB cut aggressively from October |
| ECB, Apr and Jul 2011 | Two hikes to 1.50% | Oil-driven inflation | Euro debt crisis; reversed to 1.00% by December |
| US, 2022–23 | 0–0.25% to 5.25–5.50% | CPI peak of 9.1% | Regional bank failures; inflation fell without deep recession |
Rounded from Federal Reserve, ECB and BLS historical records.
Read it twice and a pattern emerges.
Hiking works best when inflation is demand-driven and balance sheets are strong. Volcker’s recession broke inflation but cost millions of jobs. The 2022–23 cycle avoided a deep recession largely because households held pandemic savings and locked-in low rates.
Hiking into an oil shock has a poor record. The ECB’s 2008 and 2011 hikes are the closest analogies to 2026, and both were reversed within months. Central bankers know this history by heart. That they are hiking anyway suggests they judge the risk of drifting expectations as bigger than the risk of repeating 2011. That is a bet, not a certainty.
Something usually breaks. In 1994 it was bonds, in 2023 regional banks. The honest question for 2026 is not whether something cracks under a higher interest rate, but where. Likely candidates include commercial property, leveraged private credit, indebted emerging markets and heavily indebted governments.
What a Higher Interest Rate Does to Your Wallet
Macro feels abstract until the monthly payment moves. These are illustrative loans, not market quotes.
Table 7: Monthly payment sensitivity to a higher interest rate
| Loan | Interest rate | Monthly payment | Increase vs base | Extra cost per year |
|---|---|---|---|---|
| ₹50 lakh, 20-year home loan | 8.50% (base) | ₹43,391 | — | — |
| ₹50 lakh, 20-year home loan | 8.75% (+0.25) | ₹44,186 | +₹794 | ₹9,532 |
| ₹50 lakh, 20-year home loan | 9.50% (+1.00) | ₹46,607 | +₹3,215 | ₹38,585 |
| $300,000, 30-year mortgage | 6.00% (base) | $1,799 | — | — |
| $300,000, 30-year mortgage | 7.00% (+1.00) | $1,996 | +$197 | $2,367 |
Author’s calculations using standard amortisation formulas.
A one-point rise on a ₹50 lakh loan costs an extra ₹38,585 a year. Multiply that across millions of households and a policy interest rate becomes a demand-killer without anyone cancelling a purchase. Repo-linked borrowers feel it within a quarter; fixed-rate borrowers only when they refinance.
Practical takeaways:
- Borrowers: Check whether your loan floats with the policy rate. Early prepayment saves the most in a rising-rate cycle.
- Savers: Rising rates are the one upside. Short deposits reprice quickly, so avoid locking long if more hikes are likely.
- Investors: Bond prices fall when yields rise. Long-duration bonds and rate-sensitive sectors carry the most risk. This is general information, not personal financial advice.
Is There a Way Out of the Trap?
Escaping a trap rarely means picking the least bad option on the menu. It means changing the menu. Four levers could help, and none is in a central banker’s hands alone.
Table 8: Ways out of the trap
| Lever | What it does | Who controls it | Main obstacle |
|---|---|---|---|
| Reopen supply routes | Removes the cause of the price shock | Governments and diplomats | Ongoing hostilities |
| Targeted energy relief | Cushions households without boosting broad demand | Finance ministries | Thin fiscal buffers |
| Credible, brief tightening | Anchors expectations, then pauses early | Central banks | Lagged effects invite over-tightening |
| Fiscal consolidation | Lowers debt costs and eases pressure on rates | Parliaments | Politically painful |
The IMF has urged exactly this mix: keep price stability, rebuild fiscal buffers, and make any energy subsidies temporary and targeted. The logic is that monetary policy should handle expectations while fiscal policy handles the pain, and diplomacy handles the oil. When each tool does its own job, the interest rate does not have to carry the whole burden. When they work against each other, the rate carries everything and growth pays the bill.
The risk is coordination failure. A central bank that tightens while its government subsidises fuel for everyone is pushing the accelerator and the brake at once. That combination helps nobody and widens deficits, which is the very thing bond markets punish.
Three Scenarios for the Next 12 Months
These are the author’s judgement calls, not official forecasts.
Table 9: Interest rate trap scenarios, October 2026 to October 2027
| Scenario | What happens | Triggers | Likelihood (judgement) |
|---|---|---|---|
| 1. Lucky escape | Hormuz traffic normalises, Brent falls toward $70–80, central banks pause after one or two hikes | Durable shipping deal; the IMF’s 3.4% growth rebound for 2027 | Moderate |
| 2. Grinding stagflation | Oil stays near $100, inflation sticks above 3%, growth stalls near 1–2%, slow further hikes | Renewed hostilities; sticky wages | Highest |
| 3. Hard landing | Hikes, oil and debt stress trigger a credit event; central banks reverse in a hurry | Property or private-credit losses; EM currency crisis; bond tantrum | Lower, biggest impact |
The IMF’s July baseline assumed Hormuz reopening gradually from mid-July and pre-war conditions by early 2027. Fighting reignited soon after, so scenario 1 is already behind its own timetable.
What to Watch Next
Table 10: Key dates and indicators
| Date | Event | Why it matters |
|---|---|---|
| Mid-Oct | US September CPI | Did the hike cool anything, or did energy push prices up again? |
| October | IMF World Economic Outlook | Updated growth and inflation forecasts; watch 2027 downgrades |
| 20 Oct | China loan prime rate | Does Beijing keep holding while the Fed hikes? |
| 27–28 Oct | Federal Reserve meeting | Does Warsh follow with a second hike, or pause? |
| 29 Oct | ECB decision | A second consecutive hike would signal a determined campaign |
| 29–30 Oct | Bank of Japan meeting | Pace of normalisation as the policy rate nears neutral |
| 5 Nov | Bank of England decision | Do the three hawkish dissenters win over the majority? |
Two non-calendar indicators matter just as much: the Brent price, because every sustained $10 move shifts the inflation outlook, and household inflation expectations, the real reason central banks fear letting an oil shock run.
FAQs
What is the global interest rate trap?
It is the situation where central banks must choose between raising the interest rate to fight supply-driven inflation, which slows growth and strains debt, or holding and risking entrenched inflation. Neither choice fixes the underlying supply shock.
Why do higher interest rates slow the economy?
A higher interest rate makes borrowing dearer, lowers asset prices and tightens bank lending. Spending falls, which cools inflation but also cuts output and jobs, usually with a lag of 12 to 24 months.
What is the Fed interest rate right now?
As of 8 October 2026, the federal funds target range is 3.75–4.00%, after a quarter-point hike on 16 September 2026, the first since July 2023. The Fed’s September projections point to 4.00–4.25% by the end of 2026.
What is the RBI repo rate now?
The RBI raised the repo rate by 25 basis points to 5.50% on 7 October 2026 and changed its stance from neutral to “calibrated tightening.”
Can raising the interest rate fix inflation caused by oil prices?
Only indirectly. A higher interest rate reduces overall demand but cannot increase oil supply or reopen shipping routes. That is why central banks often “look through” supply shocks, unless wages or inflation expectations start rising.
Will interest rates come down in 2027?
It depends on oil. The IMF expects global inflation to ease from 4.7% in 2026 to 3.9% in 2027 if energy normalises, which would give central banks room to pause. The Fed’s September projections show no cuts by the end of 2027, so easing is not yet a base case.
How does a higher interest rate affect my loan?
If your loan floats with a policy or benchmark rate, your payment rises within a few months. On a ₹50 lakh, 20-year loan, a one-point rise adds roughly ₹3,200 a month. Fixed-rate loans are protected until the fixed period ends.
Conclusion: Escaping the Trap
The global interest rate trap is not a failure of central bankers; it is a feature of the shock they face. Oil does not respond to policy rates, but growth, jobs, housing and sovereign debt do. The world is doing the one thing economists warn against: tightening into a supply shock, with record debt and shrinking fiscal buffers.
Three conclusions follow. First, the real test is expectations, not today’s inflation print. If households and firms believe inflation will fall back, central banks can stop early. Second, the lag matters. The September hikes have barely started to bite, so “pause and watch” is rational from here. Third, resolving the oil shock is worth more than any rate decision. Diplomacy over Hormuz may do more for prices than a dozen quarter-point moves.
The interest rate is the world’s most powerful price and the bluntest tool in the box. Watch where the pain lands first, because that is where the next story starts.
What do you think? Comment Below…
